

Lensing by clusters and galaxies
Why are clusters of galaxies interesting objects?
Clusters of galaxies are the largest gravitationally bound structures in the Universe and — according to hierachical structure formation scenario — the latest structures to form. Their masses can exceed 1015 solar masses, and galaxies move within them with up to ~1500km/s.
Clusters are mostly identified in the optical by their galaxy overdensities; the richest clusters contain thousands of galaxies. Whereas the galaxy component of clusters is most easily visible, their dominant mass component is dark matter. In addition there is also smoothly distributed intracluster gas heated up to ~106K, which emitts Bremsstrahlung in Xray-frequences and also changes the energy spectrum of microwave background photons traversing them by the inverse Compton effect.
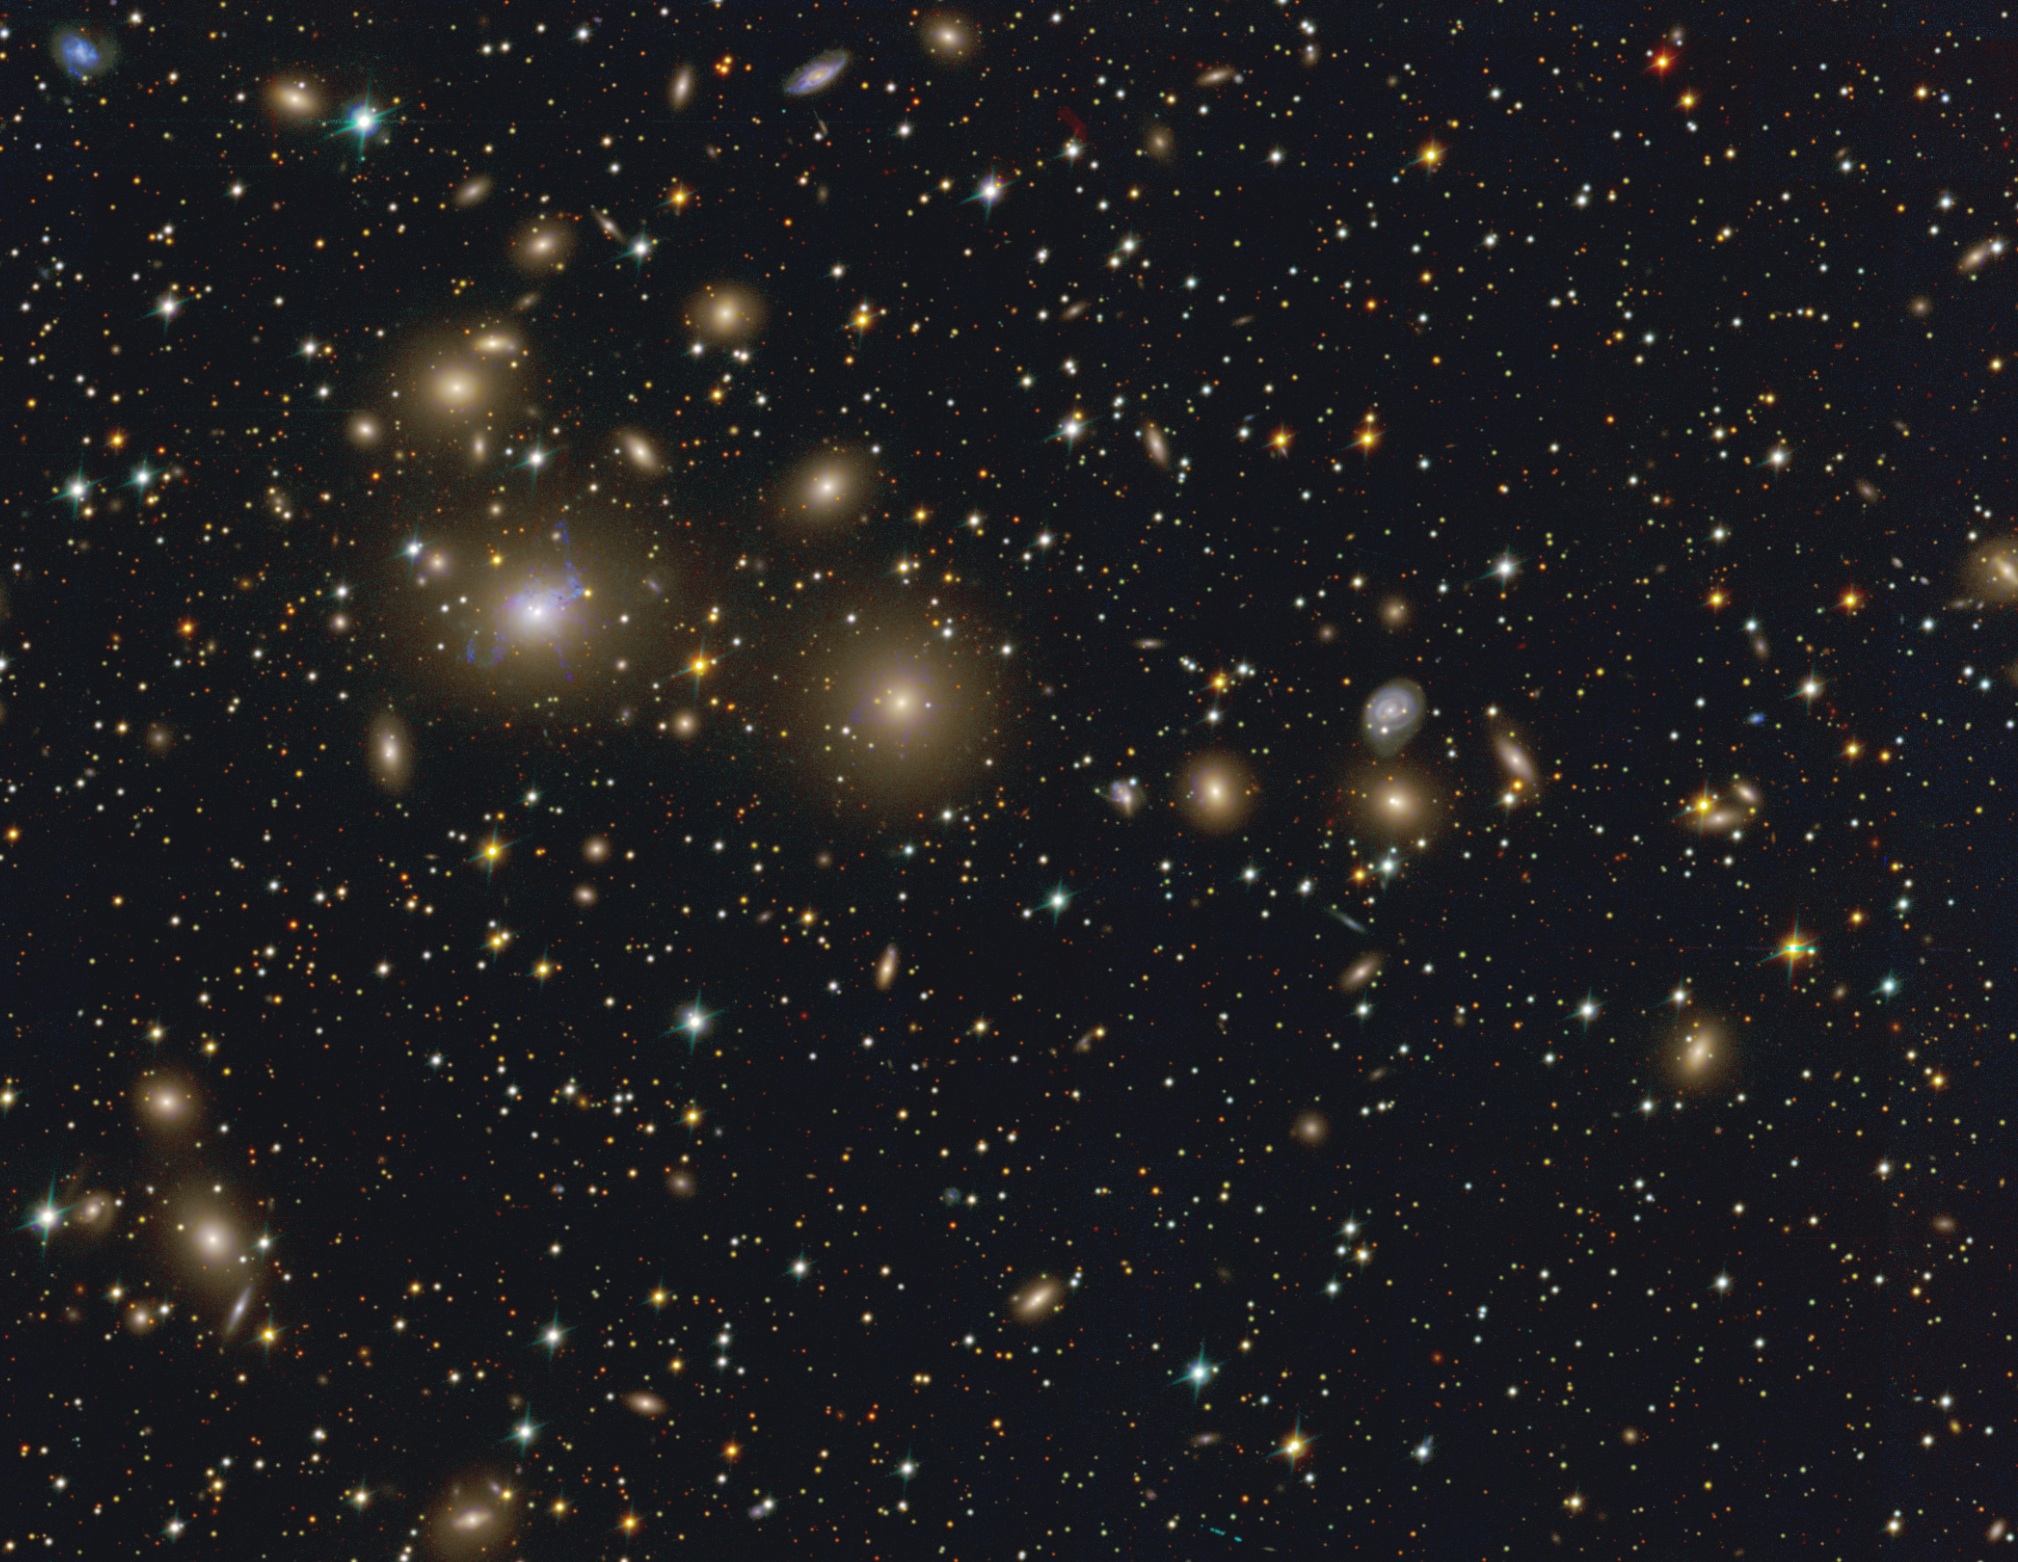
Fig. 1: Perseus cluster, imaged with the 2m Fraunhofer telescope on Mount Wendelstein
As an example we show a picture of the nearby, very massive Perseus Cluster in the left.
This color image of the Perseus cluster is composed of u-band (354nm), g-band (477nm) and r-band (623nm) data, taken with the 2m Fraunhofer telescope on Mt. Wendelstein. The Perseus cluster is at a distance of ~73 Mpc (240 Mly) and has a few thousand galaxy cluster members. The cluster members are mostly elliptical galaxies with old stellar populations (orange galaxies with extended light halos in the picture); one of these galaxies however shows recent star formation (visible in the ultraviolet light as blue filamentary structures in the bright, extended galaxy in the left). The white, orange and greenish objects with the stellar spikes are stars in the foreground in our Milky Way galaxy.
Clusters are particularly worthwhile to study, because
i) their numberdensity at a given mass and redshift is sensitive to the matter and energy density components of the universe and the measurement of these dependencies helps to constrain cosmological parameters; ii) their DM profiles are predicted to be on average "universal" for a given cosmology and dark matter properties. But the precise predictions depend also on baryonic matter and require an accurate description of the physical processes of gas, starformation and supernovae feedback in the gas and galaxy components. Hence theoretical modelleling and observational constraints have to be improved to understand the physics of clusters. iii) they contain dark matter halos, (mostly) traced by galaxies. The abundance of these substructures can be predicted for a cosmological model (depending also on the nature of DM), but also depends on the baryon physics mentioned above. iv) they provide a high density environment for the evolution of galaxies, where the role of external forces like tidal stripping, dynamical friction and galaxy collisions and mergers can be studied.
What is the contribution of our group in these science fields?
I) "Stacking" of clusters
Our group focuses on the study of the ensemble properties of galaxy clusters by utilizing the weak gravitational lensing effect.
Clusters, as overdensities of galaxies can be described by a number of observational quantities such as their optical richness (number of member galaxies brighter than some treshold), total luminosity and stellar mass, or typical environment. Our aim is to connect these visible properties with the mass properties of the cluster and its dark halo, which we can infer from gravitational lensing.
In practice the measured quantity is the gravitational shear field (γ) whose tangential component with respect to the cluster can be used to construct the Excess Surface Mass density (ΔΣ) profile of the cluster. Performing this measurement for a large number of targets, and assuming parametric models for the measured signal, we can learn about the average radial density profile of galaxy clusters. The main motivation for this kind of approach is twofold: On the one hand by grouping together similar clusters we can dramatically increase the otherwise low signal to noise ratio of the weak lensing measurements. On the other hand, it also washes away the imprint of individual irregularities in the mass distributions of galaxy clusters. This second property also enables us to directly connect with theoretical predictions and results from numerical simulations.
A currently widely used parametrization of cluster mass profiles was first proposed by Navarro Frenk and White (1997) in which two free parameters: the total mass enclosed within some characteristic scale and a concentration (shape) parameter are used to describe the clusters' mass distribution. Fig. shows this model in practice, and also illustrates how a robust description of data systematics is required before one can progress onto interpreting the measurements.
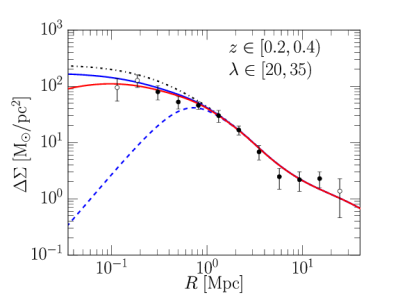
Fig. 2: The above diagram shows the ΔΣ profile of a selection of clusters in the Science Verification dataset of the Dark Energy Survey (Melchior et al. 2017). The data points are measurements obtained from weak lensing, while the red curve is the best fit model used to extract the average cluster mass. The colored lines indicate the effects of various corrections applied to the theoretical model, while the dash-dotted line is the original un-corrected model.
Analysis approaches similar to the above open up the way for scientific investigations in three broad areas, where understanding the detailed mass profiles and properties of clusters is key for furthering our understanding of the Cosmos:
1) Calibrating mass - observable relations for galaxy clusters to help constrain cosmological models.
Clusters are the most massive structures forming in the Cosmos, and such their abundance at different mass ranges can tell us about the rate of structure growth in the Universe. This quantity — the cluster mass function — is predicted by most cosmological models, however in order to compare with real observaions one needs to estimate the masses of clusters. Weak lensing observations play a crucial role here, as they can robustly connect the observed properties of clusters with the cluster mass via parametric scaling relations.
An approach adopted by several recent analyses is to measure the weak lensing profiles of many clusters in small cells of optical richness and redshift, and use the dependence of the obtained lensing profiles with respect to the selection parameters to extract a relation connecting richness, redshift and cluster mass. (Melchior et al 2017, McClintock, Varga et al in prep)
2) Studying the mass properties of the member galaxies of clusters.
Galaxies, much like galaxy clusters form along with their own dark matter halo, however as galaxies fall into larger structures during the hierachical formation of structure, their mass distribution is affected by the gravity and tides of nearby objects, most dominantly the cluster or group halo in which they end up within. These processes are expeceted to drive mass transfer from the galaxy (sub)halo to the parent halo, and robustly observing it and contrasting with our current theoretical picture would be a very strong probe of our current (cold) dark matter paradigm.
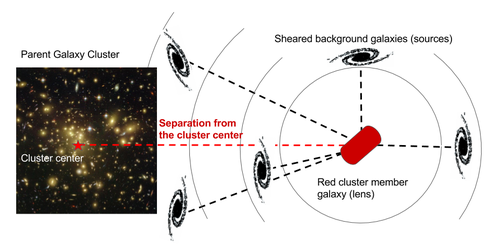
Fig. 3: Schematic of the gravitational lensing measurement of cluster members: We identify likely cluster member galaxies (indicated by the red ellipse in the figure, and select background galaxies in radial rings around them. By selecting member galaxies as a function of distance from the parent cluster, we can measure their shear profiles. This profile carries the imprint of the mass of both the parent galaxy cluster and the subhalo. By describing the joint mass distribution in a multi component model we can decouple these two components, and constrain the masses of cluster member galaxies.
As the mass transfer is expected to preferentially affect the dark halo of galaxies, lensing is an essential method in probing the mass profiles of cluster member galaxies. Weak lensing offers a way to study this effect on a very large sample of clusters and member galaxies, while requireing great care to control the various measurement systematics arising in a crowded line of sight. In addition strong lensing can help us probe this in the case of individual clusters, as descibed in a following section.
3) Investigating higher order features and environmental dependence in the mass profiles of clusters.
Clusters of galaxies inhabit the cosmic density field, and variations in their local environments may also leave an imprint on their own mass properties. From the differences in growth history reflected in the splashback features hypothesized in the mass profile, to the possible imprints of various local density environments or positions within the cosmic web, the study of clusters beyond the simple global average properties is promising to be a rich target for weak lensing analyses.
A significant part of our group's scientific work is done within the Dark Energy Survey (DES) collaboration. The Dark Energy Survey is an imaging sky survey targeting 5000 square degrees of the southern sky in four broad photometric bands (g,r,i,z) over the course of five years. While the primary goal of DES is to shed light to the currently poorly understood dark energy component of the universe, the observations, data products and scientific expertise built up during the survey also enables great scientific progress in other fields of astrophysics.
The Dark Energy Survey is conducted by an international collaboration of universities and research institutes located in the United States, Germany, United Kingdom, Spain, Switzerland, Brazil and Australia. The base of survey operations is the Cerro Tololo Inter-American Observatory in Chile, and observations are conducted by the 4-meter Blanco Telescope equipped with the Dark Energy Camera. Presently the survey has passed the Science Verification phase, and the main cosmological results from the first year of observations (DES Y1, approximately 1500 square degrees) were recently made public (link).
The main approach of the Dark Energy Survey is to constrain cosmological models via the study of structure in the late-time Universe. In this effort a strong emphasis is put on detecting galaxies and galaxy clusters, and in constructing and calibrating catalogs of source galaxies to be utilized in weak lensing analysis. Based on ongoing survey operations the limiting magnitudes of the final DES survey are expected to be (g: 24.45 mag, r: 24.30, i: 23.50, z: 22.90). In this final stage DES is expected to detect approximately 380 000 galaxy clusters, and to accurately characterize the shapes of more than 200 million galaxies for use in weak lensing analyses, enabling the study of the typical properties of galaxy clusters with unprecedented precision and accuracy.
[Fig of year 1 footprint
Footprint of DES Year 1 observations]
II) Weak Lensing analysis of clusters with the Fraunhofer telescope on Mnt Wendelstein
In general, there are two approaches to conduct weak lensing cluster studies. If a precise background sample selection is not possible because of limited photometric information, or if the source sample is too small as the survey is too shallow, only noisy weak lensing masses can be derived. This is often the case in large area surveys like DES, KiDs and CFHTLs. In this case, the shear signals of several dozen or up to hundreds of clusters can be stacked to derive the combined virial mass estimate (cf. text above).
The second approach is to derive precise cluster masses for individual targets. In this case, deep multiwavelength photometric data and excellent seeing conditions are needed. With the instruments installed at Mt. Wendelstein in the Bavarian Alps, the USM runs an observing facility which can provide deep multiwavelength data that have proven to be suitable for such precise weak lensing mass estimation using a small sample of massive clusters of galaxies.
The figure below shows the cluster of galaxies PSZ1 G186.98+38.66 at a redshift of 0.378. The object was among the first targets observed at Mt. Wendelstein for which a weak lensing analyis was performed.
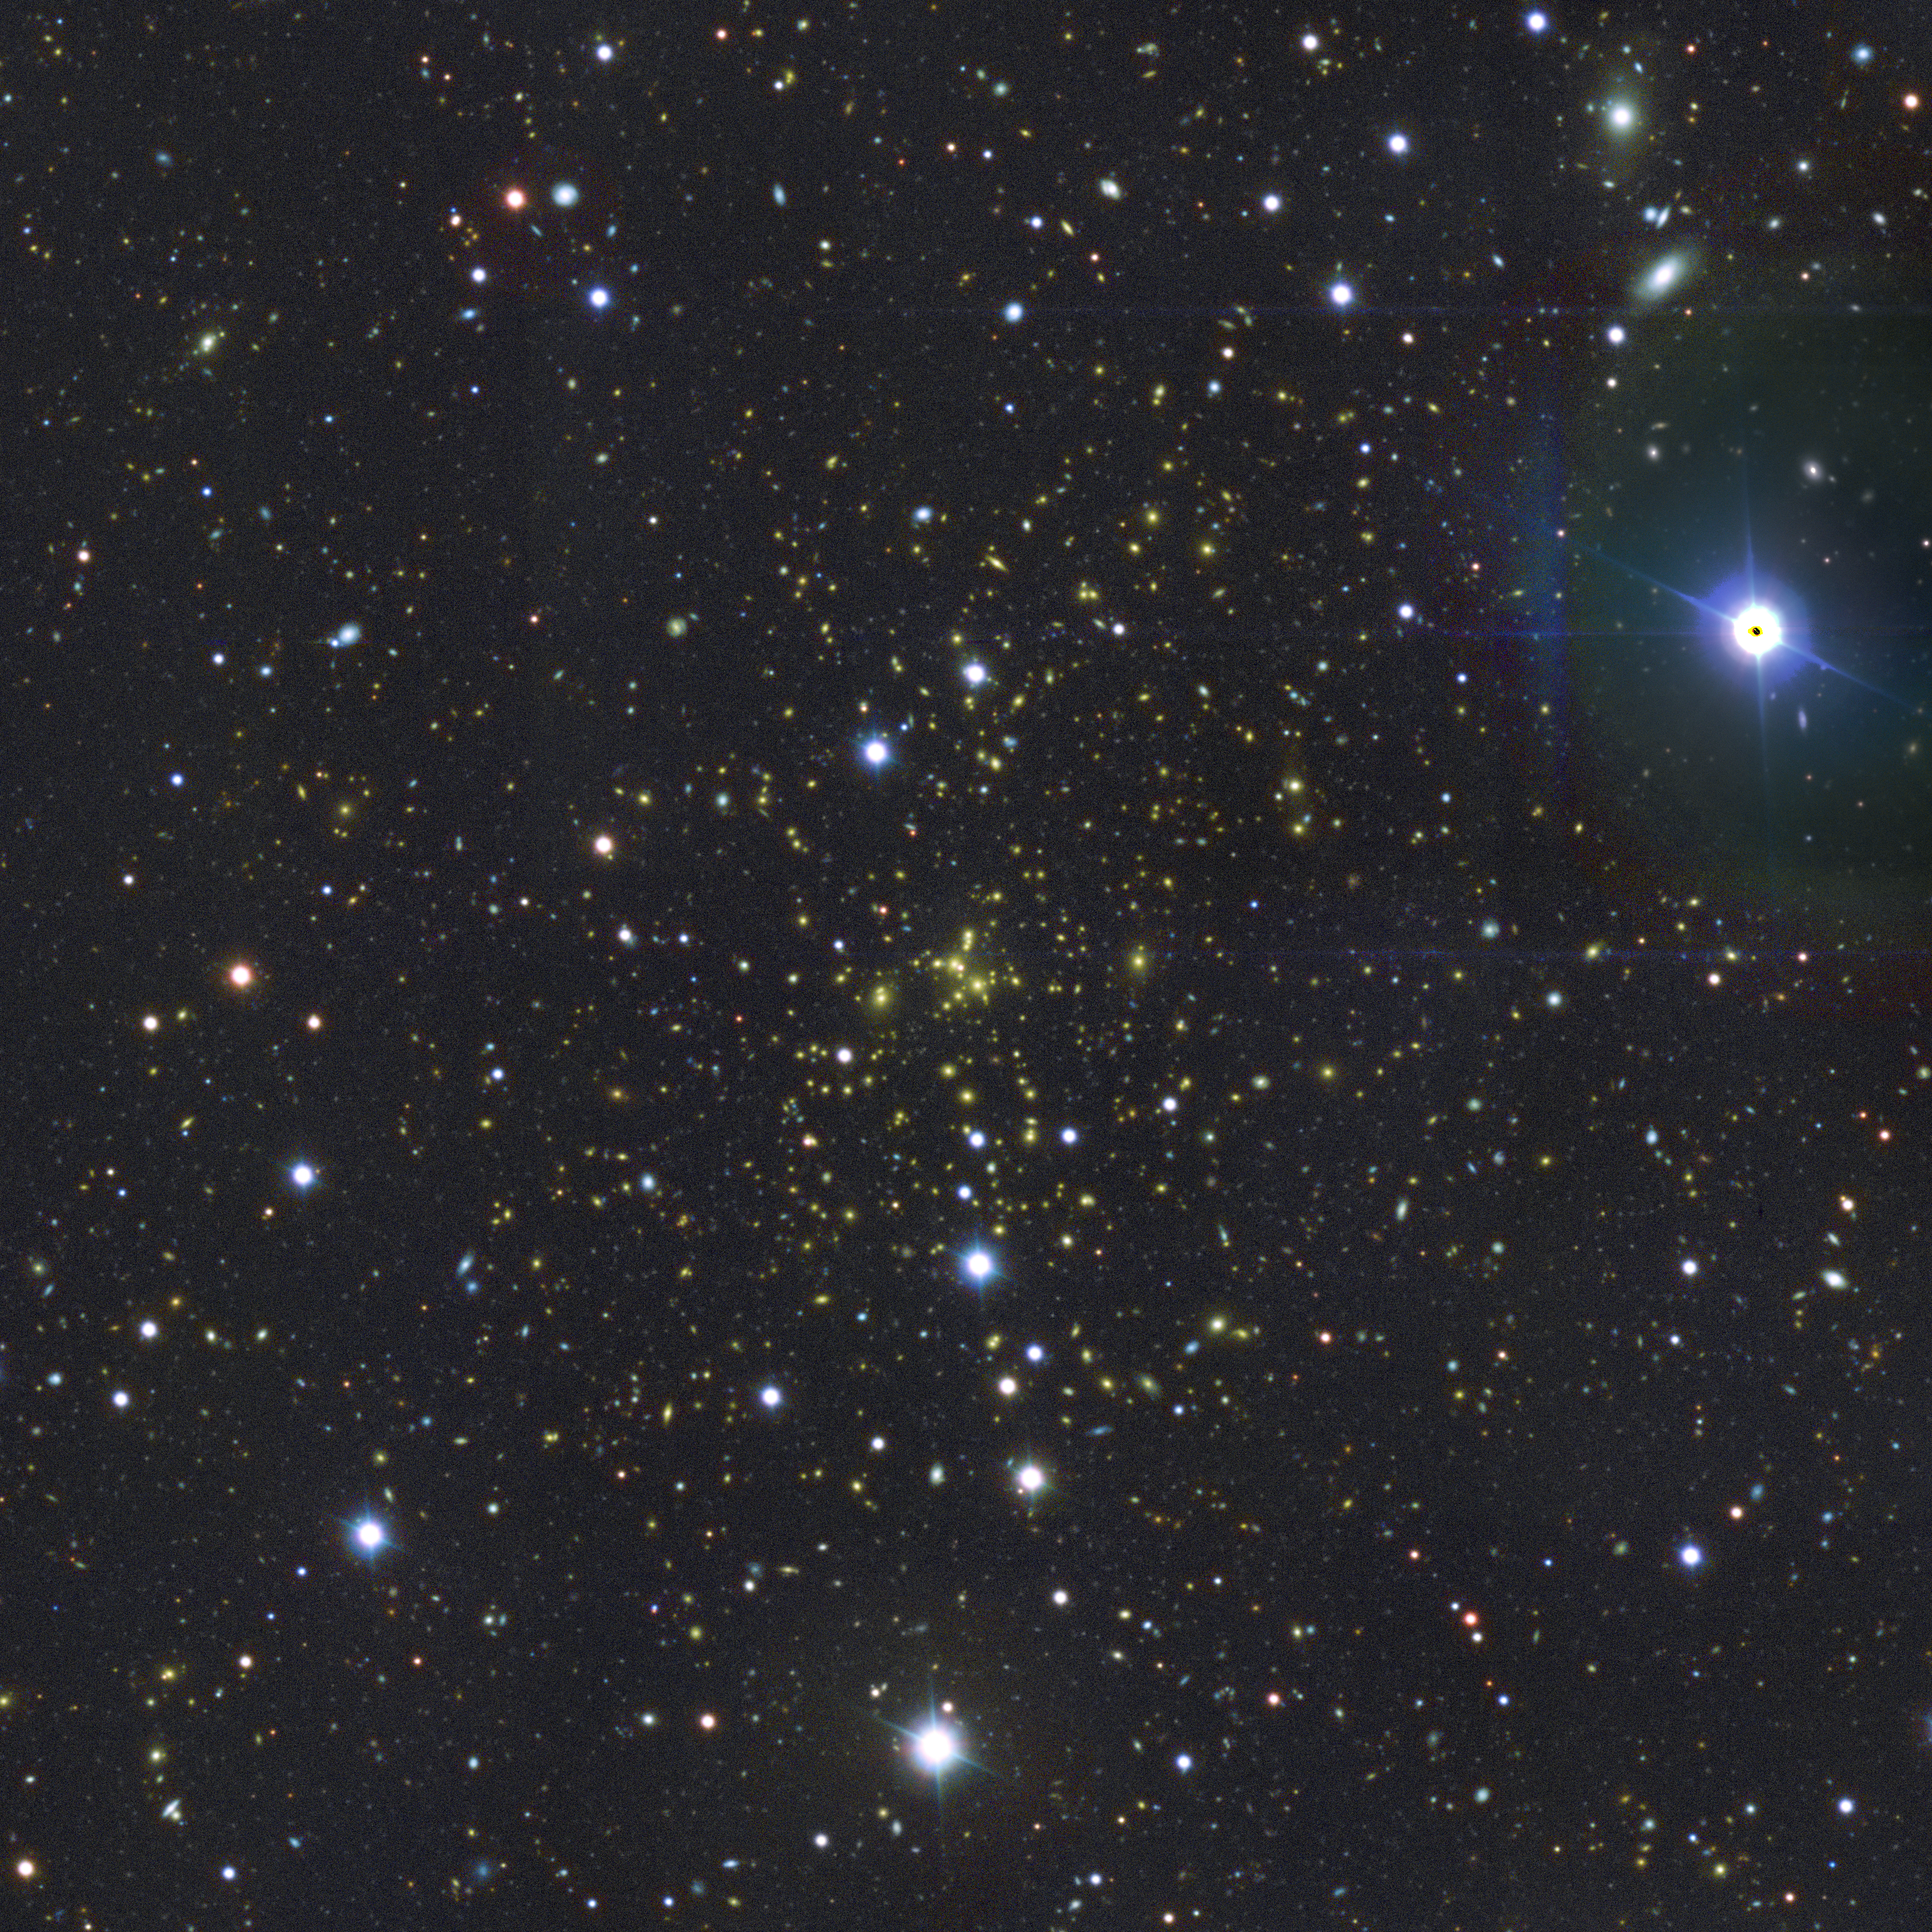
Fig. 4: RGB image using WWFI g, r and i band stacks of the galaxy cluster PSZ1 G186.98+38.66. The displayed 12' x 12' region is centered on the three brightest cluster members, which have been used as the center of the dark matter halo in our analysis. The cluster is at a redshift of 0.378 and most of its cluster member galaxies can be spotted as orange ellipticals. North-east is towards the upper right in the image.
We use the Wendelstein 2m Fraunhofer telescope with it's 30'×30' Wide Field 64Mpixel camera and map individual clusters deeply in several filters. The shear induced by the cluster can be recovered by averaging the tangential shear signal of the lensed galaxies in an annulus around the cluster center. However, the ellipticities of the galaxy images that we see have been distorted by the telescope optics and blurred by the turbulent atmosphere of the Earth (seeing). We correct for this effect by modelling the Point Spread Function (PSF), i.e. the response of the telescope optics plus atmosphere to a point source, for each image position.
To this end, we look at the stellar ellipticities in the stacked images, which would be zero if the light rays were not be influenced by the seeing. We present the whisker plot of the stacked r-band image of the galaxy cluster PSZ1 G186.98+38.66 in the Figure below (panel a). The stellar ellipticity e can be as large as 10 percent in some parts of the image plane. We model the spatial variation of the PSF as a polynomial function of position. The remaining residuals of the measured and the modeled ellipticities can be seen in panel (b). The residuals of e1 and e2 scatter around zero and are nearly symmetrically distributed, with an average value of 0.00010 (-0.00016). The number of stars used for the PSF reconstruction procedure is 874. Our results regarding the PSF correction can easily compete with those of von der Linden et al. (2014), who use SuprimeCam data to derive weak lensing masses for 51 massive galaxy clusters. The pattern of their uncorrected stellar ellipticities and the distribution of their corrected stellar ellipticities are presented in panel (c) and (d).
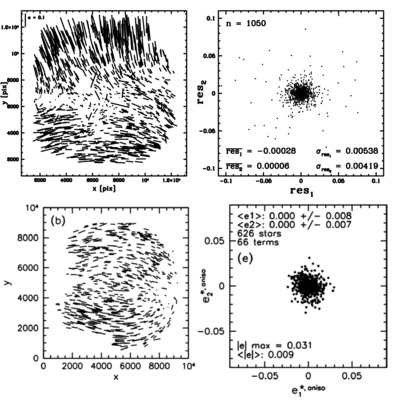
Fig. 5: Panel (a) shows a whisker plot of the stacked r-band image of the galaxy cluster PSZ1 G186.98+38.66, the remaining residuals of the measured and the modeled ellipticities can be seen in Panel (b). We compare our results to Linden et al. (2014), who use SuprimeCam at Subaru Telescope. The whisker plot of their uncorrected stellar ellipticities and the distribution of their corrected stellar ellipticities are shown in panel (c) and (d).
Having modelled the PSF locally at each galaxy position, we can estimate the pre-seeing shapes of the lensed objects. To this end, we use implementation KSB+ (Kaiser et al 1994, Luppino & Kaiser 1997, Hoekstra et al. 1998).
We make sure to include only background galaxies in our lensing sample by assigning a distance estimate to each galaxy.
In principle, we could use up to five SDSS-like broad-band filters in ugriz to create photometric redshift catalogs for the observed fields. If only data with limited photometric coverage are available, we use an empirical p(z) approach and compare the photometric information of each object to that of reference galaxies for which we have reliable photometric redshift estimates. In this way, we can filter the shape catalogs for background objects only and calculate the lensing strength Dds/Ds for each galaxy.
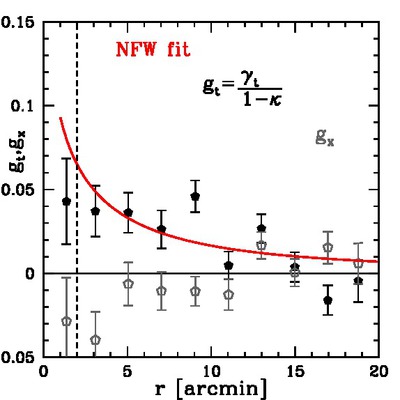
Fig. 6: The reduced tangential shear profile of the cluster of galaxies PSZ1 G186.98+38.66 (black symbols) and the cross component of the shear (grey symbols). The red line shows the expected shear assuming an NFW dark matter density profile with virial mass M200m = 30.9 × 10¹⁴ M⊙.
We present the tangential shear signal as measured for PSZ1 G186.98+38.66 in the plot above. The reduced tangential shear can be measured from the galaxy elipticities directly. The cross component of the reduced shear is consistent with zero with a reduced χ2-value of 1.27 and indicates no significant systematics in our shape catalog. By fitting density profiles derived from simulated clusters (NFW) to the measured shear, we obtain accurate weak lensing mass estimates for the individual clusters. The red line indicates the best fitting modeled shear caused by an NFW dark matter halo with virial mass M200m = 30.9 × 10¹⁴ M⊙.
One way of visualizing the two-dimensional lensing signal is to calculate the significance of the aperture mass map as a function of position. To this end we measure the tangential shear inside circular weighted apertures (Schneider 1996) and show contours of Map/σMap at levels increasing from 2.0 in steps of 0.5 in the figure below. We use a Gaussian weight function with a width of 2' and center the plot on the three BCGs of PSZ1 G186.98+38.66.
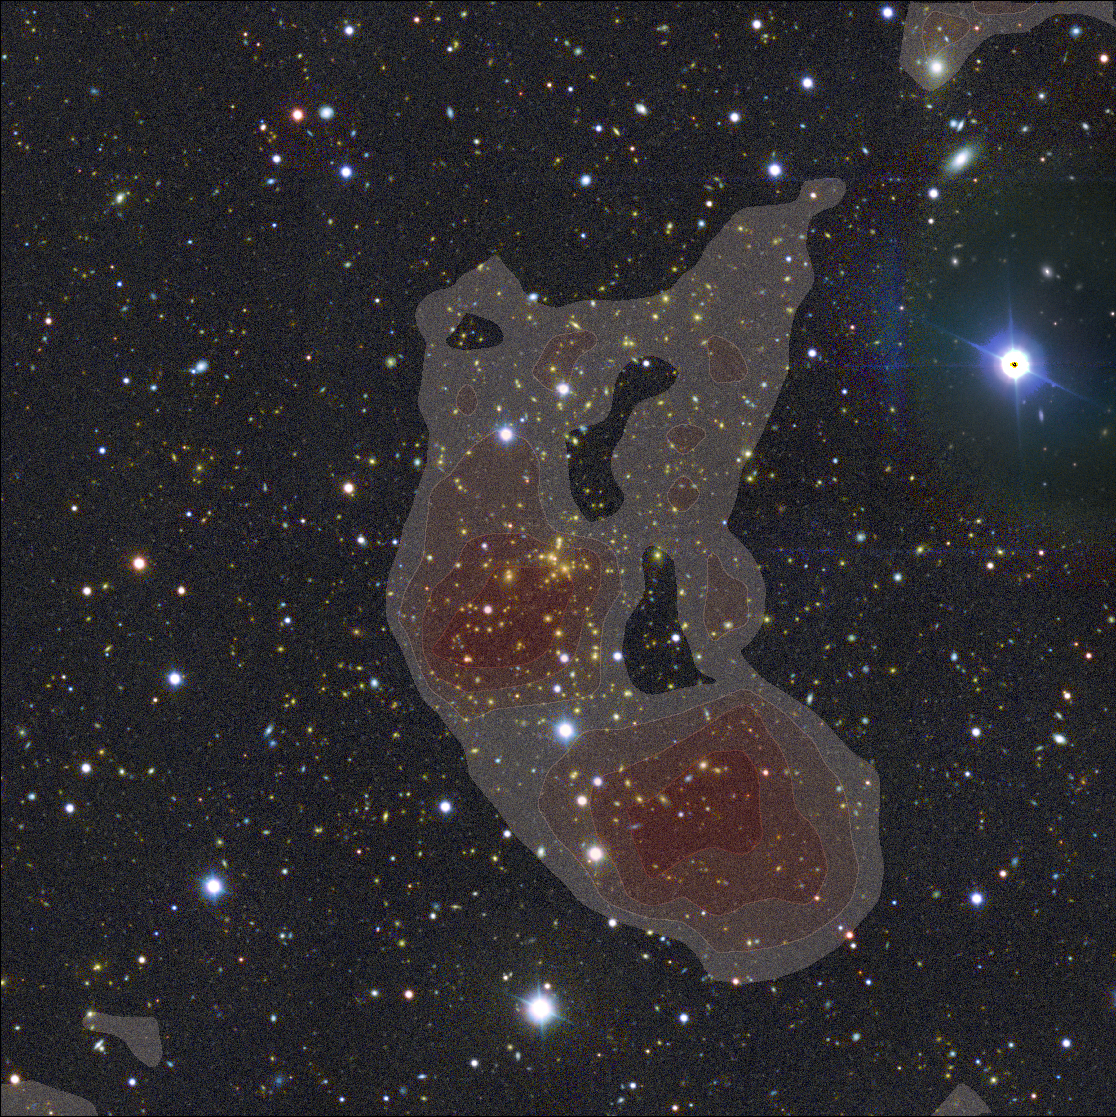
Fig. 7: RGB image using WWFI g, r and i band stacks of the galaxy cluster PSZ1 G186.98+38.66. The red shaded regions show contours of the aperture map significance at levels increasing from 2.0 in steps of 0.5. The displayed 12' x 12' region is once again centered on the three brightest cluster members. North-east is towards the upper right in the image.
In conclusion, the well reconstructable PSF pattern of the Wendelstein WFI, the sub-arcsecond seeing at the observing site and the sparsity of ghost images in the images guarantee a successful weak lensing mass estimation using magnitude limited catalogs of faint background galaxies in cluster fields.
III) Combined strong lensing analysis and weak lensing analysis of clusters
With strong gravitational lensing we measure the central dark matter distribution of clusters with high precision, and hence we measure also the central density slopes. Combined with the cluster weak lensing results it shows us whether the concentration-mass relation of clusters follows the prediction obtained for numerically simulated clusters in cold dark matter universes.
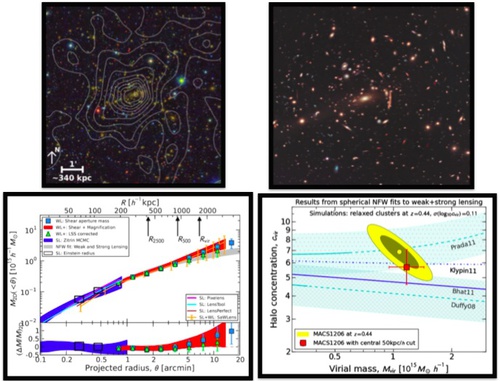
Fig. 8: The upper left panel shows a large field of view of cluster MACSJ1206, overplotted are surface mass density contours obtained from the weak lensing analysis
The upper right panel shows the corresponding central field of view, imaged with the Hubble Space Telescope.
Lower left panel: Combined constraints on the mass profile from strong lensing (blue) and week lensing (red)
Lower right panel: Constraints on the mass-concentration from the combined weak and strong lensing analysis
Image Credit: Umetsu et al. 2012, 2016 & STSci, Baltimore
We now use the example of the cluster MACSJ1206 (a "CLASH" cluster at redshift of z=0.439) to outline the procedure. The upper left panel of the figure above shows the cluster as imaged from ground with the Subaru Telescope. The field of View shown in this color image is 8'x8' corresponding to a side length of about ~2.7Mpc at the cluster redshift (The total field of the data for this camera is about 30'x30'). The cluster members are mostly orange. Using the shape of the weakly lensed background objects a mass density map was derived and is displayed in the white contours. The mass distribution is dominated by the dark matter component but nevertheless is centered on the most luminous "central" galaxy, and it has elliptical isodensity curves with a major axis where the orientation is similar to that of the density distribution of the red cluster members.
In the upper right panel of the figure above one can see another image of the same cluster, which was obtained with the Hubble-Space Telescope. For this image the field of view shown is only about ~2'7, i.e. about 900kpc, i.e. we see a much smaller region but with a much higher spatial resolution. We see a "giant arc" and many multiple images (more detail see below). These strong lensing signatures have been used to model and measure the azimuthally averaged projected mass profile out to about 1 arcminute. The weak lensing data have been used to measure the same quantity between ~1' out to ~10'. The result is shown in the lower left panel of the figure above, the blue regions are the confidence areas for the profiles from strong lensing (inner part) and the red ones are those from weak lensing (out part of the cluster). We see, that strong lensing and weak lensing results agree within the overlapping region (at around 1'). From such a combined mass profile we can measure the corresponding values of the universal "NFW" profile (concentration c and mass M) as displayed in the lower right sub panel of the same figure. The green shaded regions show predictions that several teams have obtained for numerically simulated clusters. An analysis of 20 such "CLASH" clusters by Umetsu et al 2016 then showed that profiles for massive clusters are well described by NFW and Einasto profiles, but single power law or cored isothermal profiles are disfavored by the data. [References: Umetsu et al. 2012, Umetsu et al. 2016].
-Using strong gravitational lensing, we measure the halo masses of cluster galaxies near to the cluster center. Often we can do this only in a statistical way (assuming scaling relations) but in some cases cluster members are so close to the lines of sight to arcs and multiple images that their individual impact on the lensing signal allows us to determine their individual halo parameters. We show an example (Eichner et al. 2013) for the same cluster we considered before, i.e. for MACSJ1206: The cluster as imaged by HST is already shown in the last figure above (upper right panel).We see many cluster galaxies (appearing in mostly orange color in the image). In the center there is the so called "cD" galaxy. This is also close to the center of mass, and the location where the dark matter halo has its highest density. We see many objects that are strongly distorted; they are typically bluer (because they are starforming field galaxies in the background of the cluster) and sometimes have low surface brightness contours connecting them. Some of them are multiply imaged galaxies, or form arc-systems, where images are merging/connected with each other.
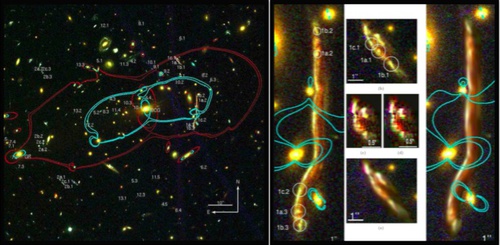
Fig. 9: the left panel shows the central field of MACSJ1206, imaged with the Hubble Space Telescope, multiple images are indicated as well as critical lines for two different source galaxy redshifts
The right panel shows observed arc (left subpanel), predicted arc (right subpanel), observed counterimage (upper subpanel), predicted counter image (lower subpanel), unseen source (central subpanels).
The figure above shows multiple image families that have been identified by us. E.g., objects 13.1, 13.2 and 13.3 belong to the 13th multiple imaged galaxy and this galaxy is imaged into 3 images. System "1" is the giant arc, where we can identify subcomponents in the lensed galaxy "1" that correspond to each other (e.g. subcomponent 1a.1, 1a.2, 1a.3). A closer look at the giant arc (see the left subpanel in the right panel) shows that this arc is bent by the cluster galaxies around its line of sight. We modelled the mass distribution of the cluster in a parametric way, including the mass distribution of the cluster members. Our best lensing model reproduces the observations (see the left supanel of right panel) at an amazing accuracy. This allowed us to measure the total mass of cluster members close to the arc and to demonstrate that they have only about a tenth of the mass compared to field galaxies with the same optical properties. The "missing" mass is redistributed in the smooth cluster component when galaxies are falling into the cluster are stripped by tidal forces. [References: Eichner et al. 2013]