

Photometry & Kinematics of nearby Brightest Cluster Galaxies
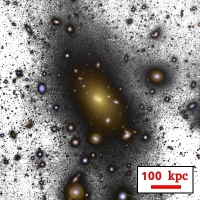 |
| Fig. 1: u',g',r' color image of A2199 with the BCG NGC6166 in the center of the image. The data was obtained with the WWFI. The deep, stretched and inverted g'-band image is overlayed to visualize the extended ICL. |
Galaxy clusters are one of the largest gravitationally bound structures in the universe. They consist of ~90% dark matter, ~9% hot gas and ~1% stars. The latter component is found in tens, hundreds or even thousands of galaxies. One of these galaxies usually appears as the distinctively brightest cluster galaxy (BCG) near the centre of the cluster potential. It is not necessarily brightest in terms of surface brightness, but in terms of total brightness due to its enormously extended light profiles (see fig. 2). The halo stars of the BCG mirror the high velocity dynamics of the cluster. Hence, they are referred to as intracluster stars or intracluster light (ICL). It needs to be mentioned that the radial transition from the BCG to the ICL is smooth.
The ICL is incredibly faint and therefore difficult to detect. It is only possible using telescopes with low internal reflections and low straylight contamination, like the 2m Fraunhofer Telescope at Mt. Wendelstein, which is being operated by the USM. Both its Wide Field Imager (WWFI) and its 3-channel-camera (3kk) have proven themselves to be suitable instruments for this task.
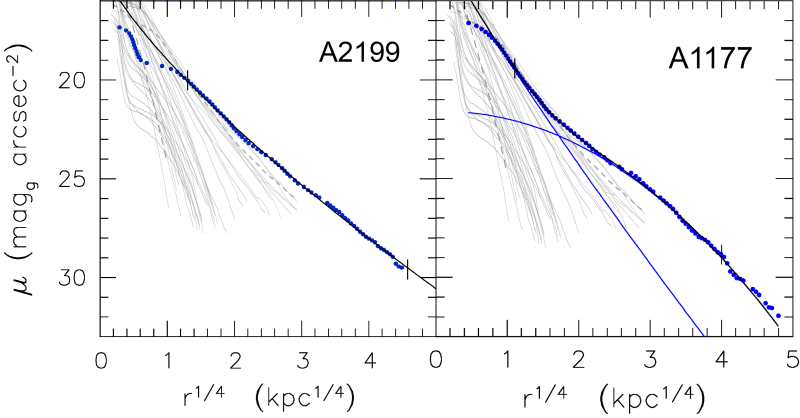 |
| Fig. 2: Upper panel: The surface brightness profile of a typical single-Sérsic BCG NGC6166 in the galaxy cluster A2199 is shown with blue dots and the Sérsic Fit with a black line. Lower panel: The surface brightness profile of a typical double Sérsic BCG NGC3551 in A1177 is also shown in blue dots. The two Sérsic components are shown as blue lines and the sum of both components in shown as a black line. For comparison, both panels have the surface brightness profiles of the Virgo ellipticals overplotted, as measured by Kormendy et al. [2009]. |
Our primary goal is to measure the BCG+ICL's light profiles down to an unprecedented depth of 30 mag as^(-2) in the optical g'-Band. This corresponds to 1/3.000th of the night-sky brightness in a dark and moonless night. We perform deep observations for a large volume-limited sample (redshift z < 0.08 and declination > 5°) of 130 galaxy clusters. We also observe a subsample in the near-infrared Ks-band to obtain color information.
With the help of these photometric datasets, we will (1) put a lower boundary on the radial extent of the ICL, (2) detect possible color gradients that translate into different stellar ages and metallicities in the BCG / ICL components and (3) recover the fraction of single- and double-Sérsic BCGs: the former type has a smooth light profile whereas the latter type has a characteristic bump in the light profile and can all in all be well fitted by a sum of two Sérsic functions. The outer component of double-Sérsic BCGs is historically interpreted as the ICL, but it is an unsolved question whether this decomposition truely separates the two components. We aim to solve this question with the help of an additional kinematic dataset:
 |
 |
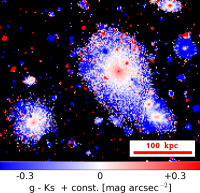
| Fig. 3: g'-Ks colormap of the galaxy cluster A671. The g'-band image was obtained with the WWFI and the Ks-band image was obtained with the 3kk. The stellar outskirts of the BCG have bluer colors as compared to the core of the BCG in the center of the image. |
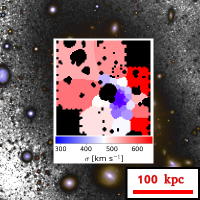
Fig. 4: The stellar velocity dispersion map of NGC6166 is overlayed on the zoomed-in image of NGC6166. The transition from BCG to ICL is visible as an increase in the average random motion of the stars. |
We utilize the VIRUS-P spectrograph at the 2.7m Harlan J. Smith Telescope and the LRS2 spectrograph at the 11m Hobby Eberly Telescope at the McDonald Observatory in Texas, US, to measure the stellar line-of-sight-velocity-distribution (LOSVD) of a subsample of eight representative BCGs from our large photometric sample. Integral field spectrographs like the VIRUS-P and LRS2 measure spatially resolved spectra, i.e. provide datacubes with a spectrum for each pixel.
The LOSVD stores information on the stellar velocity dispersion which is a measure of the random motion of the stars. We find that the velocity dispersion rises outwards. This behaviour is atypical for elliptical galaxies and clearly a signature of the high-velocity ICL. By assuming that the BCG and ICL are hosting two separable stellar populations with different characteristic velocities, we will compare the simple decompositions in position-space (Sérsic components) to the more reliable decompositions in velocity space.
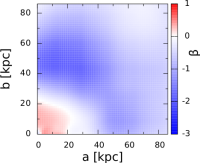 |
| Fig. 5: Anisotropy map of NGC6166. Red (blue) colors translate into radial (tangential) anisotropy in the velocity dispersion. |
We will create orbit-based dynamical models for eight BCG, constrained by our photometric and kinematic datasets. These models will allow us to recover another observable that cannot be directly measured: the orbit anisotropy, i.e. whether the stars are on more radial or on more tangential orbits. This observable provides implications on the formation history of the BCG and ICL:
The anisotropy in the stellar velocity dispersion of core ellipticals -- in which category most BCGs fall -- is radial at large radii [Thomas 2014]. Our preliminary dynamical model of NGC6166 shows the same radial bias below r < 20 kpc, but the surprising result is that the velocity dispersion becomes tangentially anisotropic at larger radii. This is consistent with a two-phase scenario in which the intracluster stars were tidally stripped from satellite galaxies after the main body of the BCG was already formed.